Simulating Sines in XAML
November 19, 2006
New York, NY
Those of us who suffer from advanced Xamlholism can no longer even think about a programming challenge without wondering whether it could be done entirely in XAML. And once we are sure an all-XAML solution is possible, we don't care how ugly or how wasteful the result may be. The most important objective of our obsession is seeing it run in IE, and saying proudly (or rather, thinking proudly, because no one else is really interested in our addiction) "I did it entirely in a single XAML file."
Not every WPF programmer has this sickness. Ian Griffiths' WPF Data Binding: Harmonic Series Visualization, for example, is an elegant mix of C# code and XAML. This program demonstrates proper (and admirable) programming moderation, and there's some nice stuff in there. I particularly like the "generation" of the Slider controls as data templates in an ItemsControl. Change one number in the program — the first argument to the HarmonicSeries constructor in Windows1.xaml.cs — and you get more or fewer sliders as a result.
Well, seeing this nice piece of code was enough to trigger my Xamlholism to kick in, and I went on a binge. (And on a Sunday morning, no less.) My goal was to do something similar, but entirely in XAML. I toyed around with displaying a polyline, but came to the conclusion that the XAML would just be way too repetitious, even for my low Xamlholic standards.
So, I decided to use an animation instead. What you see is a little red dot tracing out the curve on an oscilloscope-like screen, so I called the file:
It looks like this:
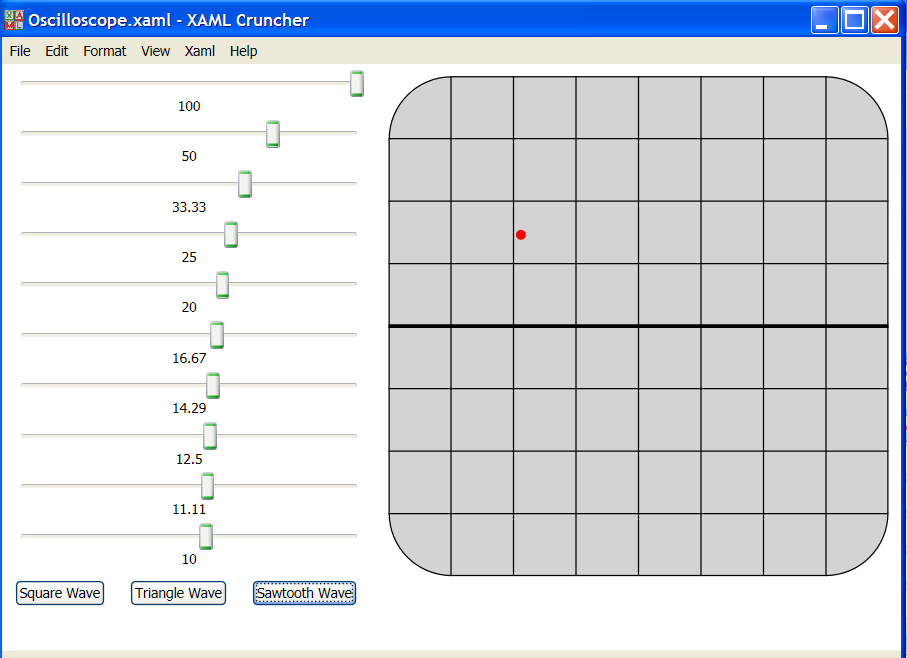
The 10 sliders correspond to the first 10 harmonics, and you can set the amplitude of each to anything from -100 to 100. There are also three buttons down at the bottom for presets. Clicking the buttons sets the 10 sliders for a square wave, triangle wave, or sawtooth. (Of course, the results are only approximate because only 10 harmonics are involved. Adding more harmonics to my solution involves a lot of ugly cut-and-paste-and-modify.)
Before you try to figure out how this program works, you might want to look at SingleSineCurve.xaml. This simpler program just displays the first harmonic with a constant amplitude of 100. It has two animations: The first simply moves the red dot along the x-axis from left to right, repeated forever. The second animation animates a double from 0 to 360, again repeated forever. The second animation targets the Angle property of a RotateTransform, which is part of a RenderTransform for an invisible element. That RenderTransform also contains a ScaleTransform with a fixed ScaleY attribute of 100. In the composite transform, the M21 element of the matrix is equal to -100 times the sine of the animated angle. That number is bound to a TranslateTransform of the red dot to move it up and down.
In Oscilloscope.xaml, there's one animation for the horizontal movement of the red dot, and 10 animations for 10 RotateTransforms for 10 invisible elements, where each RotateTransform is combined with a ScaleTransform that's bound to one of the 10 Slider controls. The RenderTransform of the red dot is a composite of 10 TranslateTransforms, each of which is bound with the M21 element of the RenderTransform matrix of the 10 invisible elements.
I know, I know, I know. This is totally perverted. But as an active Xamlholic, this is the type of thing that to people like me is "having fun."
November 20 Postscript: I added the buttons very late in developing this file. I only discovered after Oscilloscope.xaml was posted that clicking one of the buttons then renders the sliders from being changed by hand. I'm not sure how to fix this problem, except to refresh the file in Internet Explorer.