New York Liberty 80, Chicago Sky 69
August 6, 2006
Roscoe, NY
We felt we just had to see one more New York Liberty game at Madison Square Garden before the end of the season, even though they're in second to last place in the Eastern Division and won't come anywhere near the playoffs. I'm embarrassed to say that we so much wanted to see the Liberty win that we chose the game where they were playing the very last-place team, the Chicago Sky, and we drove into the City yesterday for the game.
Well, the strategy worked, but it wasn't very pretty. I would have preferred watching a game between the two first-place teams rather than the two last-place teams, but that was not to be this year.
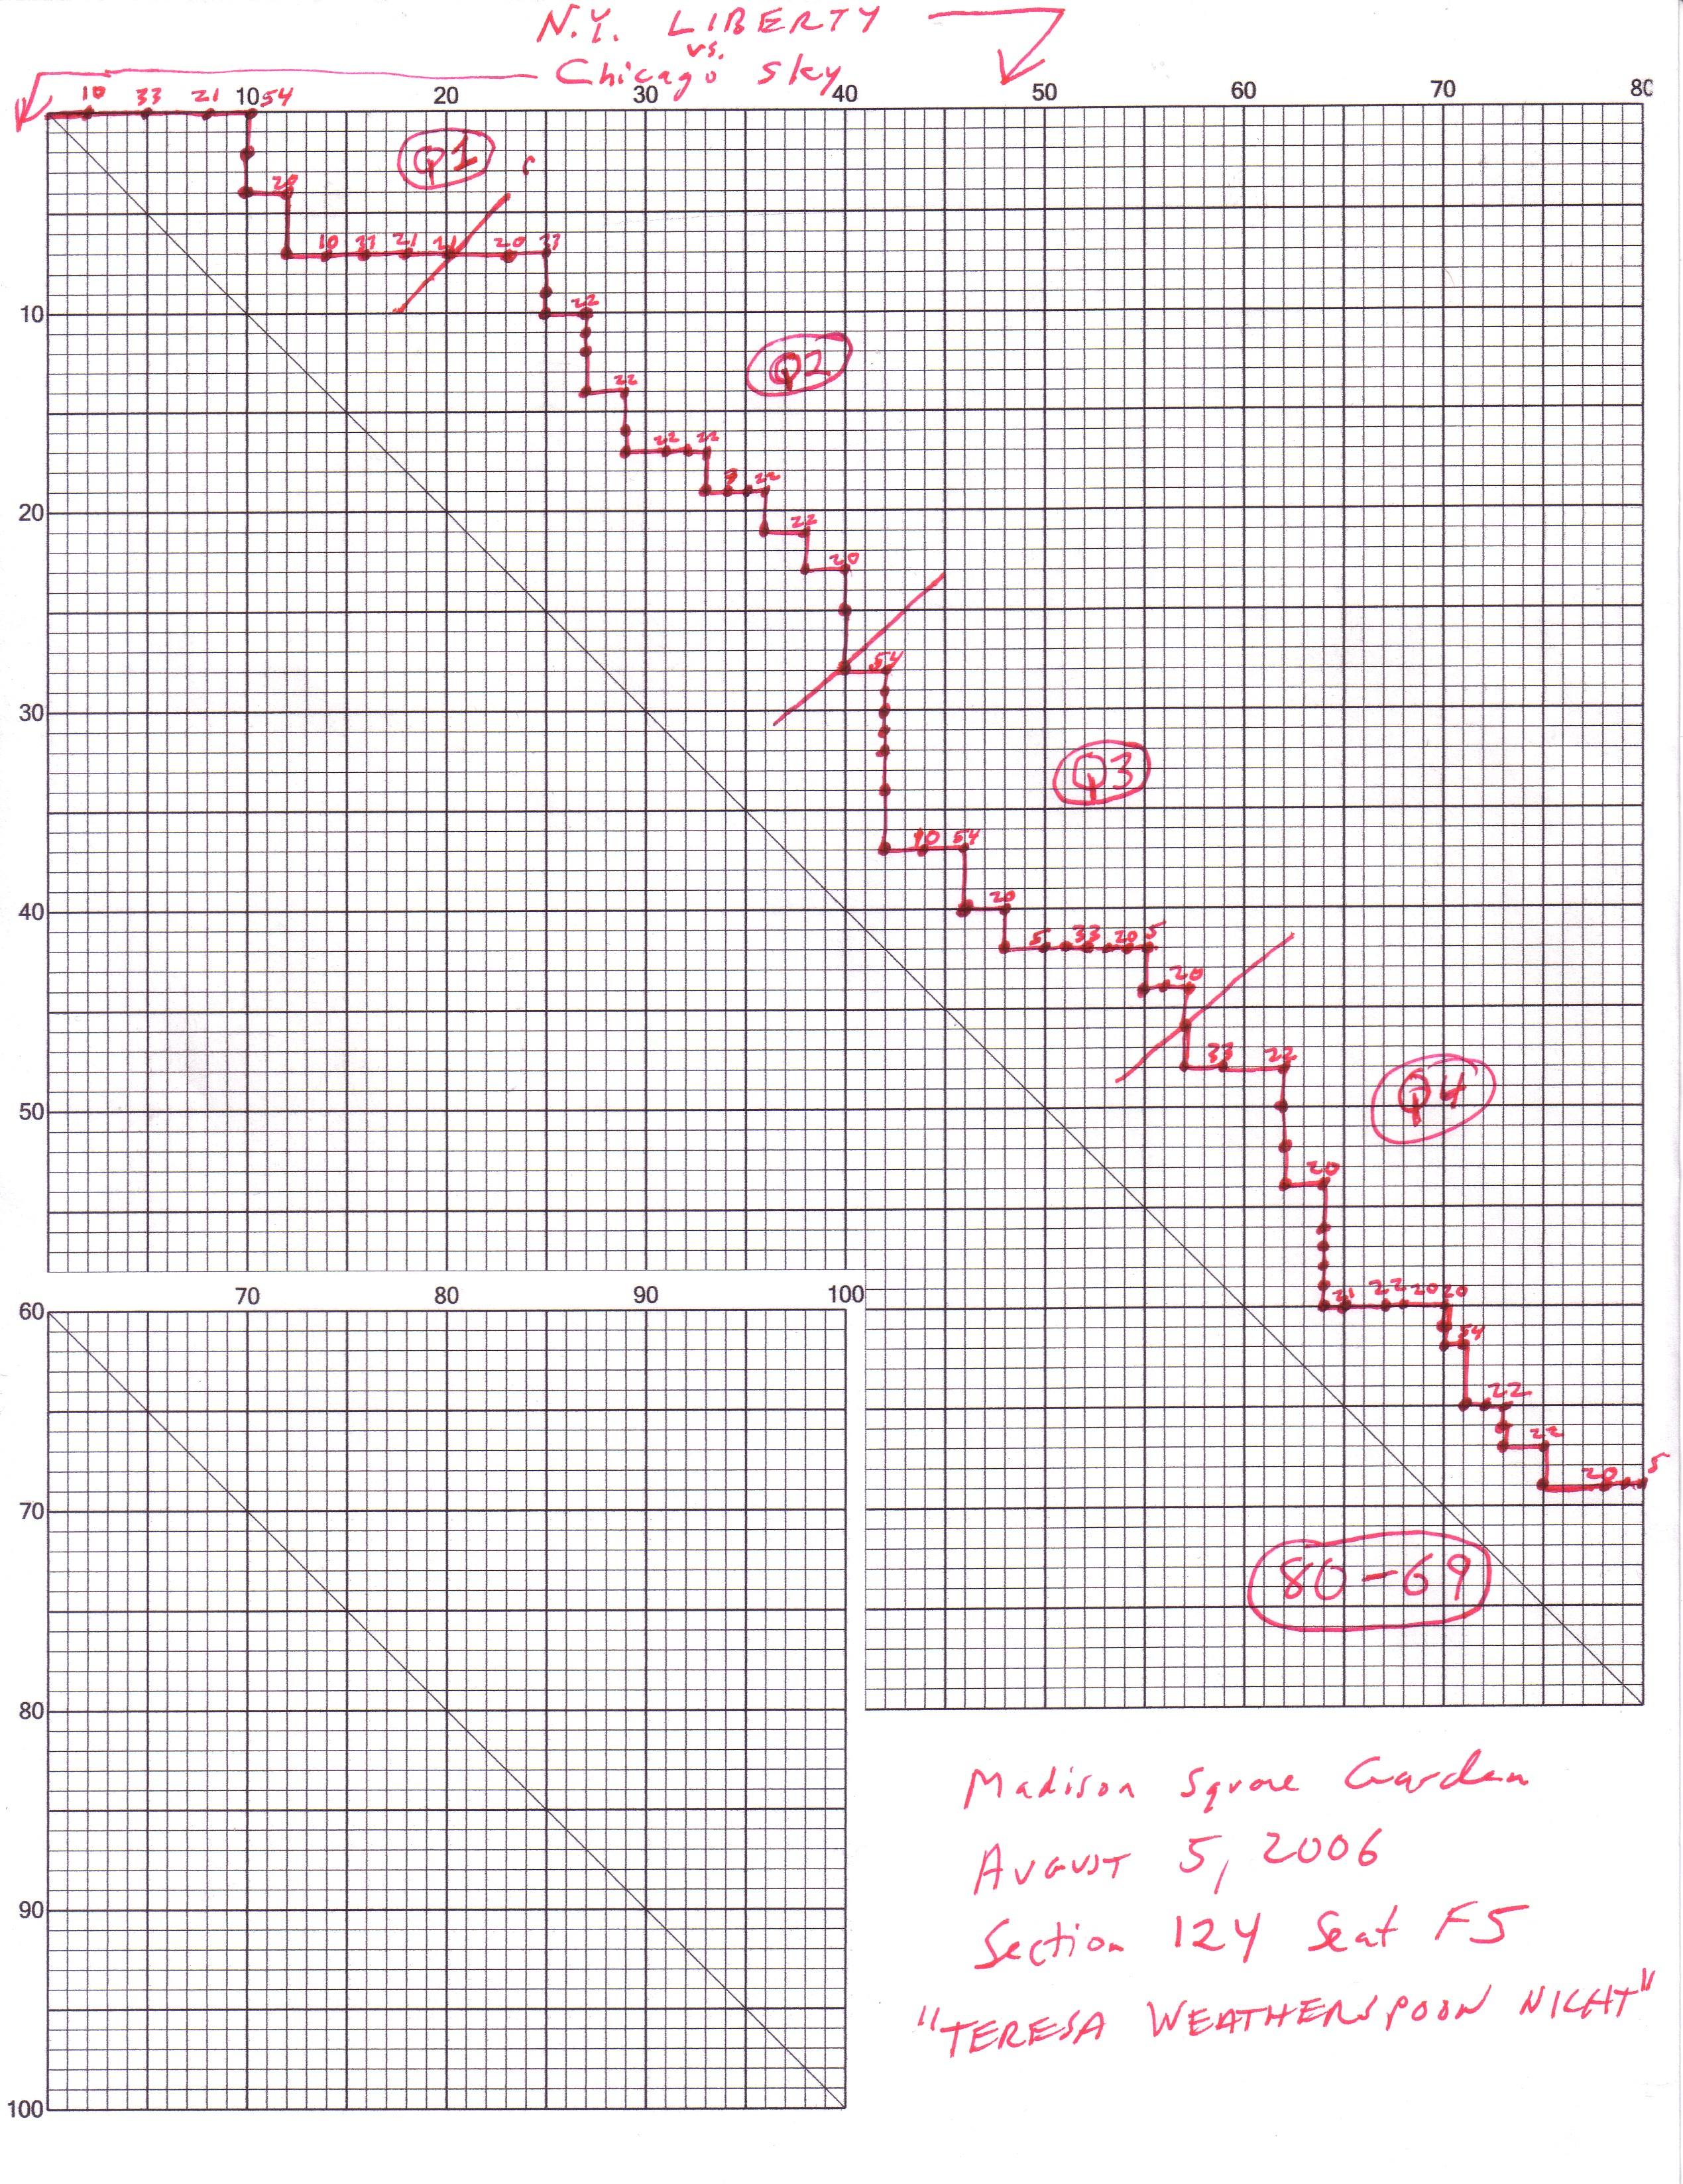
I like the high-scoring nature of basketball, and how sometimes one team gets into a run for some apparent momentum, and other times it's more of a back-and-forth scoring, and I wanted some way to visualize that. A couple years ago I wrote a little program to print a simple graph (shown below), where the horizontal axis represents points by one basketball team, and the vertical axis represents points by the other team. The diagonal represents a tied score. During the game, I mark each point, as shown below:
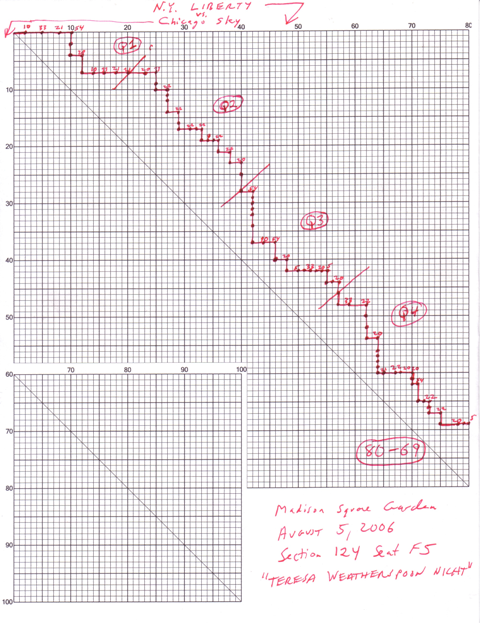
10 megabyte 300 dpi version suitable for framing
Each dot represents the basketball going through the basket, and I indicate the player who made that point above the dot. (I do this only for the Liberty players, but it could also be done for the other team as well.) A three-pointer is thus distinguished from a two-pointer with a successful free throw. In the latter case, there are two dots, and the player's number only appears once on the second dot. Obviously lots of other stuff — turnovers, rebounds, assists, etc. — is just ignored, but you really do get a sense of when a team is on a run, and when the teams are scoring about equally.
If sitting at a basketball game coloring in a graph is the type of thing that appeals to your nerdy mind, you can recreate my graph by downloading and compiling the BasketballGrid.csproj, BasketballGrid.cs, and PrintableForm.cs files. It's a WinForms program, and clicking the client area of the window prints the graph on your default printer. (The PrintableForm.cs file is from my Programming Windows with C# book.)
During half-time in the game yesterday was a special tribute to Teresa Weatherspoon, who was the heart and soul of the New York Liberty during the first seven years of its existence.